Introduction
The Sessions Over Time chart on the Insights page lets you track session activity across the selected period and break it down by engagement-status bucket. Use this view to understand how often your audience returns and to plan communications for distinct viewer groups.
Sessions Over Time
The Sessions Over Time line chart appears in the middle of the Insights page. It plots session activity over the selected time range and uses an engagement-status legend (New, Engaged, Re-engaged, and so forth) to color the buckets.
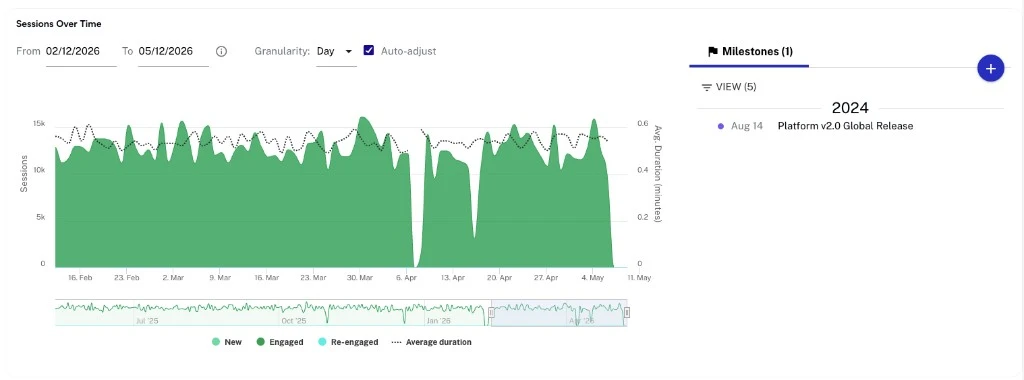
- New — Users with a view in the last week but none in the last year.
- Engaged — Users with multiple views in the last month and no gap longer than 28 days between views.
- Re-engaged — Users with a view in the last week but no views in the prior four weeks.
- Average duration — Average duration in minutes per session.
Time range and granularity
The chart uses the page-level date-range and granularity controls described in the Usage Trends topic.
Milestones
The Milestones panel beside the Usage Trends chart lets you mark significant business events (releases, launches, campaigns) so you can correlate them with audience behavior. Milestones persist across the Insights page.
Adding a milestone
Click the + button on the Milestones panel to add a new milestone. Enter a date and a label, then save.
Viewing and filtering milestones
Use the VIEW control at the top of the Milestones panel to choose which milestones are visible. Each visible milestone is plotted as a marker on the Usage Trends, Sessions Over Time, and Content Trends charts.
Editing or deleting a milestone
Click an individual milestone in the list to edit or delete it.