Introduction
Engagement-status metrics let you determine how often your audience interacts with your service. With this information, you can build communication strategies aimed at different groups of viewers to keep them coming back.
Engagement Status Over Time
Hover over any point on the Sessions Over Time chart to see a breakdown for that day or week. The status buckets are defined as follows:
- New — Users with a view in the last week but none in the last year.
- Engaged — Users with multiple views in the last month and no gap longer than 28 days between views.
- Re-engaged — Users with a view in the last week but no views in the prior four weeks.
- Recent — Users with no views in the last week but at least one view in the prior three weeks.
- Idle — Users with no views in the last four weeks but at least one view in the prior eight weeks.
- Inactive — Users with no views in the last 12 weeks but at least one view in the last year.
- Dormant — Users with no views in the last year.
Milestones
The Milestones panel beside the Usage Trends chart lets you mark significant business events (releases, launches, campaigns) so you can correlate them with audience behavior. Milestones persist across the Insights page.
Adding a milestone
Click the + button on the Milestones panel to add a new milestone. Enter a date and a label, then save.
Viewing and filtering milestones
Use the VIEW control at the top of the Milestones panel to choose which milestones are visible. Each visible milestone is plotted as a marker on the Usage Trends, Sessions Over Time, and Content Trends charts.
Editing or deleting a milestone
Click an individual milestone in the list to edit or delete it.
Key Metrics
The Key Metrics tile row on the Insights page surfaces the headline engagement numbers across the selected time range.
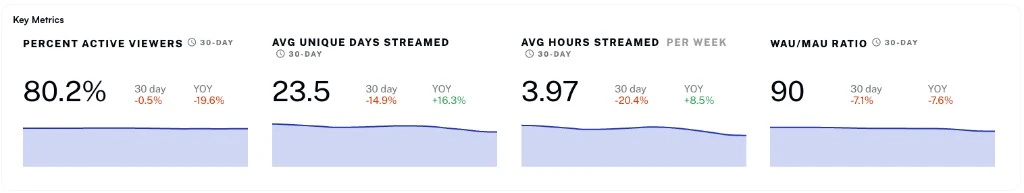
- Percent Active Viewers — Percentage of your audience that was active in the period.
- Avg Unique Days Streamed — Average number of distinct days a viewer streamed in the period.
- Avg Hours Streamed Per Week — Average hours streamed per active viewer per week.
- WAU/MAU Ratio — Weekly Active Users as a percentage of Monthly Active Users.
Each tile shows a 30-day delta and a year-over-year (YOY) delta beneath the headline value.