Introduction
Quality of Experience (QoE) analytics provide information to help understand the user's video streaming experience, including playback success, startup time, rebuffering, and visual quality.
QoE focuses on metrics that provide a sense of the viewing experience from a user's perspective. It is Brightcove's goal to provide customers with a transparent, meaningful, and well-curated set of metrics focused on the following:
-
Troubleshooting:
- Which devices and players have a lower quality of experience?
- Are issues related to the player, device, or geographic region?
- Can I mitigate these issues?
-
Reporting:
- How is my service performing across key QoE metrics?
- Are there trends that I should be aware of and address?
-
Monitoring:
- You can track video metrics that show how viewers are impacted.
For a list of QoE terms and definitions, see the Glossary section.
Setup
Brightcove QoE Analytics are available to Media Video Cloud customers at no extra charge. Contact your Customer Success Manager to enable your account.
QoE Insights
Brightcove QoE Insights builds on the analytics in this topic, and incorporates user engagement data to provide greater understanding of audience behavior. For details, see the Brightcove QoE Insights document.
Navigation
Once your account is enabled for QoE Analytics, you will find them in the Analytics module in Studio.
- Open Video Cloud Studio.
- In the left navigation, click the Analytics icon.
- In the Analytics left navigation, click Quality of Experience (QoE).
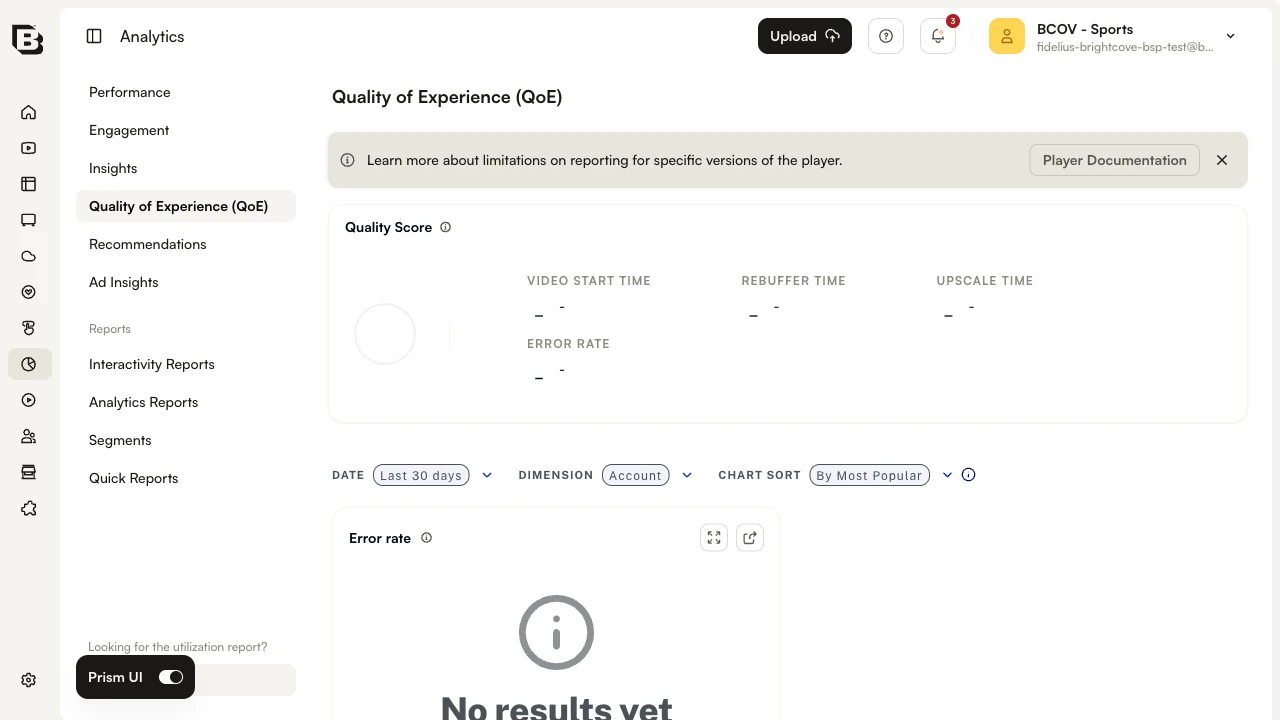
Time range and dimensions
Use time range and dimension to filter the data displayed in the charts below.
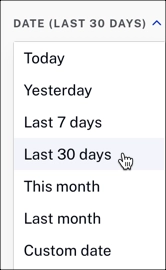
Time range selector
Click the DATE dropdown to select the time range for the data on the page. The charts below trend over time, based on the time range you select.
Dimension selector
Click the DIMENSION dropdown to select the measurement for your reporting data. When you select a dimension, it is reflected in all of the charts described below.
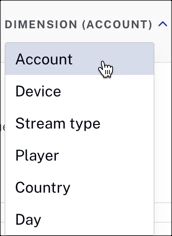
Dimensions
Account
The Account view provides an overall number for all streams in your account across all platforms.
Device
The Device view makes it easier to see device-specific issues and trends over time, helping you identify patterns such as a spike in error rate for a specific device family.
This graph shows the top 5 devices by view count, and the account level.
OS version
The OS version view groups streams by the operating-system version reported by the player, helping you spot regressions tied to a specific OS release.
Stream type
The Stream type view compares all content in your account with VOD and Live metrics.
Player
The Player view shows specific players' performance and allows you to isolate and troubleshoot players where QoE is underperforming. Modifications to chunk size and buffer size can be measured using this metric.
This graph shows the top 5 players by view count, and the account level.
Player version
The Player version view breaks metrics down by player build, useful for confirming that a new player release is performing as expected before you roll it out broadly.
Country
For international customers, viewing QoE metrics by country can assist in isolating regional issues, such as the impact of switching to a new content delivery network (CDN) in a given region.
This graph shows the top 5 countries by view count, and the account level.
Day
The Day view bins metrics by calendar day so you can correlate dips or spikes with releases, incidents, or scheduled events.
Video start time
The video start time is the average time between play request and stream start.
This metric is helpful because long load times cause abandonment before streaming starts. Long load times can point to issues with CDN, player plug-ins, and initial stream bitrate where intervention makes sense. Low video start times mean your viewers can start watching their videos quickly, which is what they expect.
This example shows the top 5 devices by view count, and the account level.
Summary table
The summary table makes it easy to explore and identify anomalies.
The date range and dimensions that you set for the page, also applies to the data in the summary table. For example, if you select the Device dimension, you will see a Summary by Device.
Summary by Device
Each column is sortable. The default sort order is video views descending.
In addition to the key metrics, the summary table includes the following data:
- View count
- Video resolution breakdown
- Rebuffering time
- Avg Bitrate
For details about the column data, see the Glossary below.
Glossary
Error rate
Percent of all play requests with errors that prevented playback experience.
Errors are often caused by player or player plugin misconfiguration. Viewing error rate by device or player can provide direction on where to focus on reducing errors. You can review our Brightcove Player Error Reference for more information on player errors.
Video start time
Average time between the play request and the stream start per video view; this time does not include ad pre-roll time.
The number of player plugins that load, initial stream bitrate, and viewer bandwidth can impact start time. Reviewing players, bitrate ladder, and device/video resolution breakdown can provide direction on improving this.
Counting errors
Distinct fatal errors per session, per viewer. If multiple errors occur in a session, they are de-duplicated.
Video resolution
Percent of engagement events issued by categories of video resolution.
Reviewing resolution breakdown by device in combination with video start time, rebuffering time, and stall rate can show ways to optimize playback.
Rebuffering time
Average seconds of buffering per hour of video viewed.
This often increases when the bandwidth is too low to consume the bitrate of the stream that is playing. Looking at bitrate and video resolution by device or country can provide insights into video resolution adjustments that could reduce rebuffering.
Stall Rate
Stalls per hours viewed in the time range.
Stall rates often increase when the bandwidth is too low to consume the bitrate of the stream that is playing. Looking at bitrate and video resolution by device or country can both provide insights into video resolution adjustments that could reduce rebuffering.
Avg bitrate
Average bitrate (kbps) across all video views in the time range.
Upscale time
Average seconds per hour spent in an upscaled state.
Upscaling has a real impact on picture clarity when video resolution is significantly lower than screen resolution. Review screen resolutions by device to understand the potential impact of upscaling better. Consumers using 4K TVs will often have upscaling occur, but the viewing experience can still be high quality.