Navigation
To access the Analytics Tab, follow these steps:
- Log in to your Video Cloud account.
- In the primary navigation, click Media.
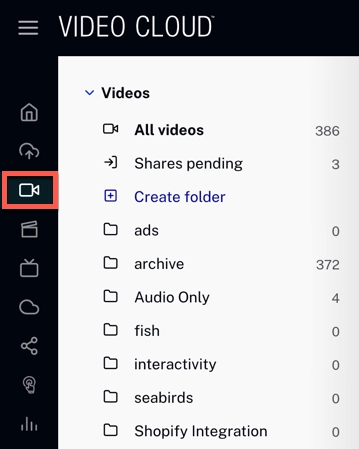
left-navigation - Click the link for the video you want to see the analytics.
- At the top of the page, select the Analytics tab.

Analytics Tab
All time
The All time statistics summarize a set of metrics that allow the user to view the status of each asset at a glance.

The following metrics are shown in the All Time section. Each one of the cards provides the All Time statistics, the Today statistics, and the statistics for the Daily Average.
- Video Views - Tracks the number of times a video started playing
- Video Impression - Tracks the number of times the video was loaded into a player and ready for interaction
- Completion Rate - Tracks the completion rate for the video. It calculates the average percentage completed: avg_percentage_completed / video_views
- Viewed minutes - Tracks the total number of minutes the video was viewed
- Engagement Score - Tracks the average percent watched per video view (calculated by adding all the percentage watched divided by the number of Video Views)
- Play Rate - Tracks the percentage of users that played the video after it was loaded (Video Views divided by Video Impressions)
- Unique Viewers - Tracks the views for the video
Engagement
The Engagement section allows the user to play the video and view the number of views in the line chart at every section of the video.

Actions
 to export data as a CSV or XLSX file.
Performance
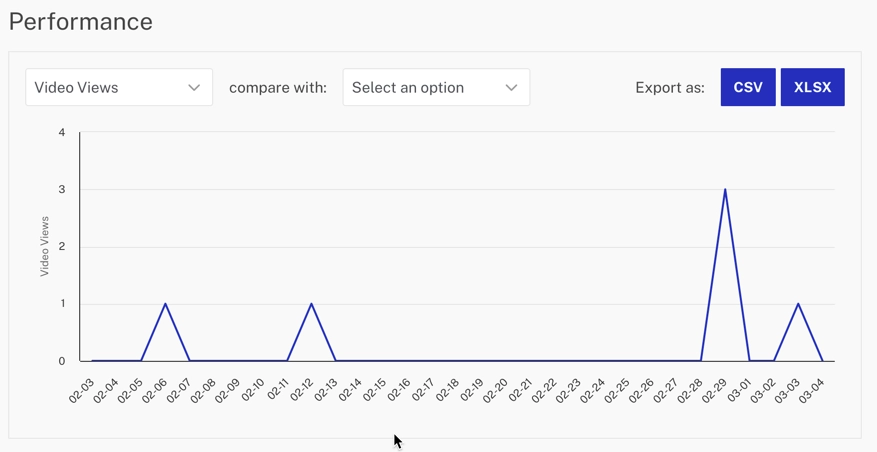
The Performance section allows the user to visualize the video performance data for the last 30 days and compare the data with different dimensions.
Actions
- Click
 to select a metric. The available metrics are Video Views, Video Impression or Play Rate.

- Click
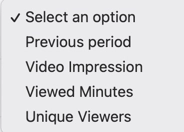
 to compare the main metric to the Previous Period, Video Impression, Viewed Minutes, or Unique Viewers.
- Click
 to export data as a CSV or XLSX file.
Engagement and Performance
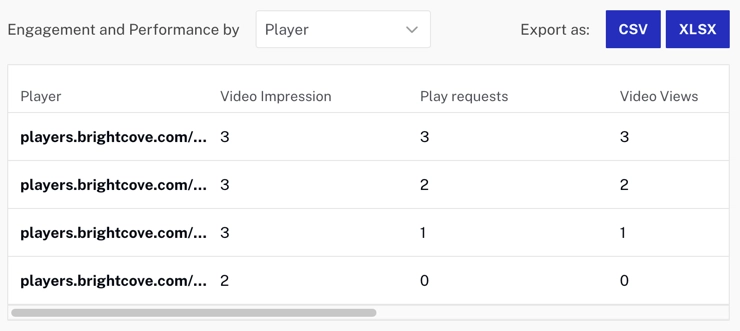
The following table summarizes the Engagement and Performance data by different dimensions.
Actions
- Click
 to group the data by Viewer, Player, Display Domain, Device, or Country.

- Click
 to export data as a CSV or XLSX file.
Caption and Audio Track Analytics
The Caption and Audio Track Analytics section displays two tables that provide insights into how viewers interact with caption and audio track options for the video.
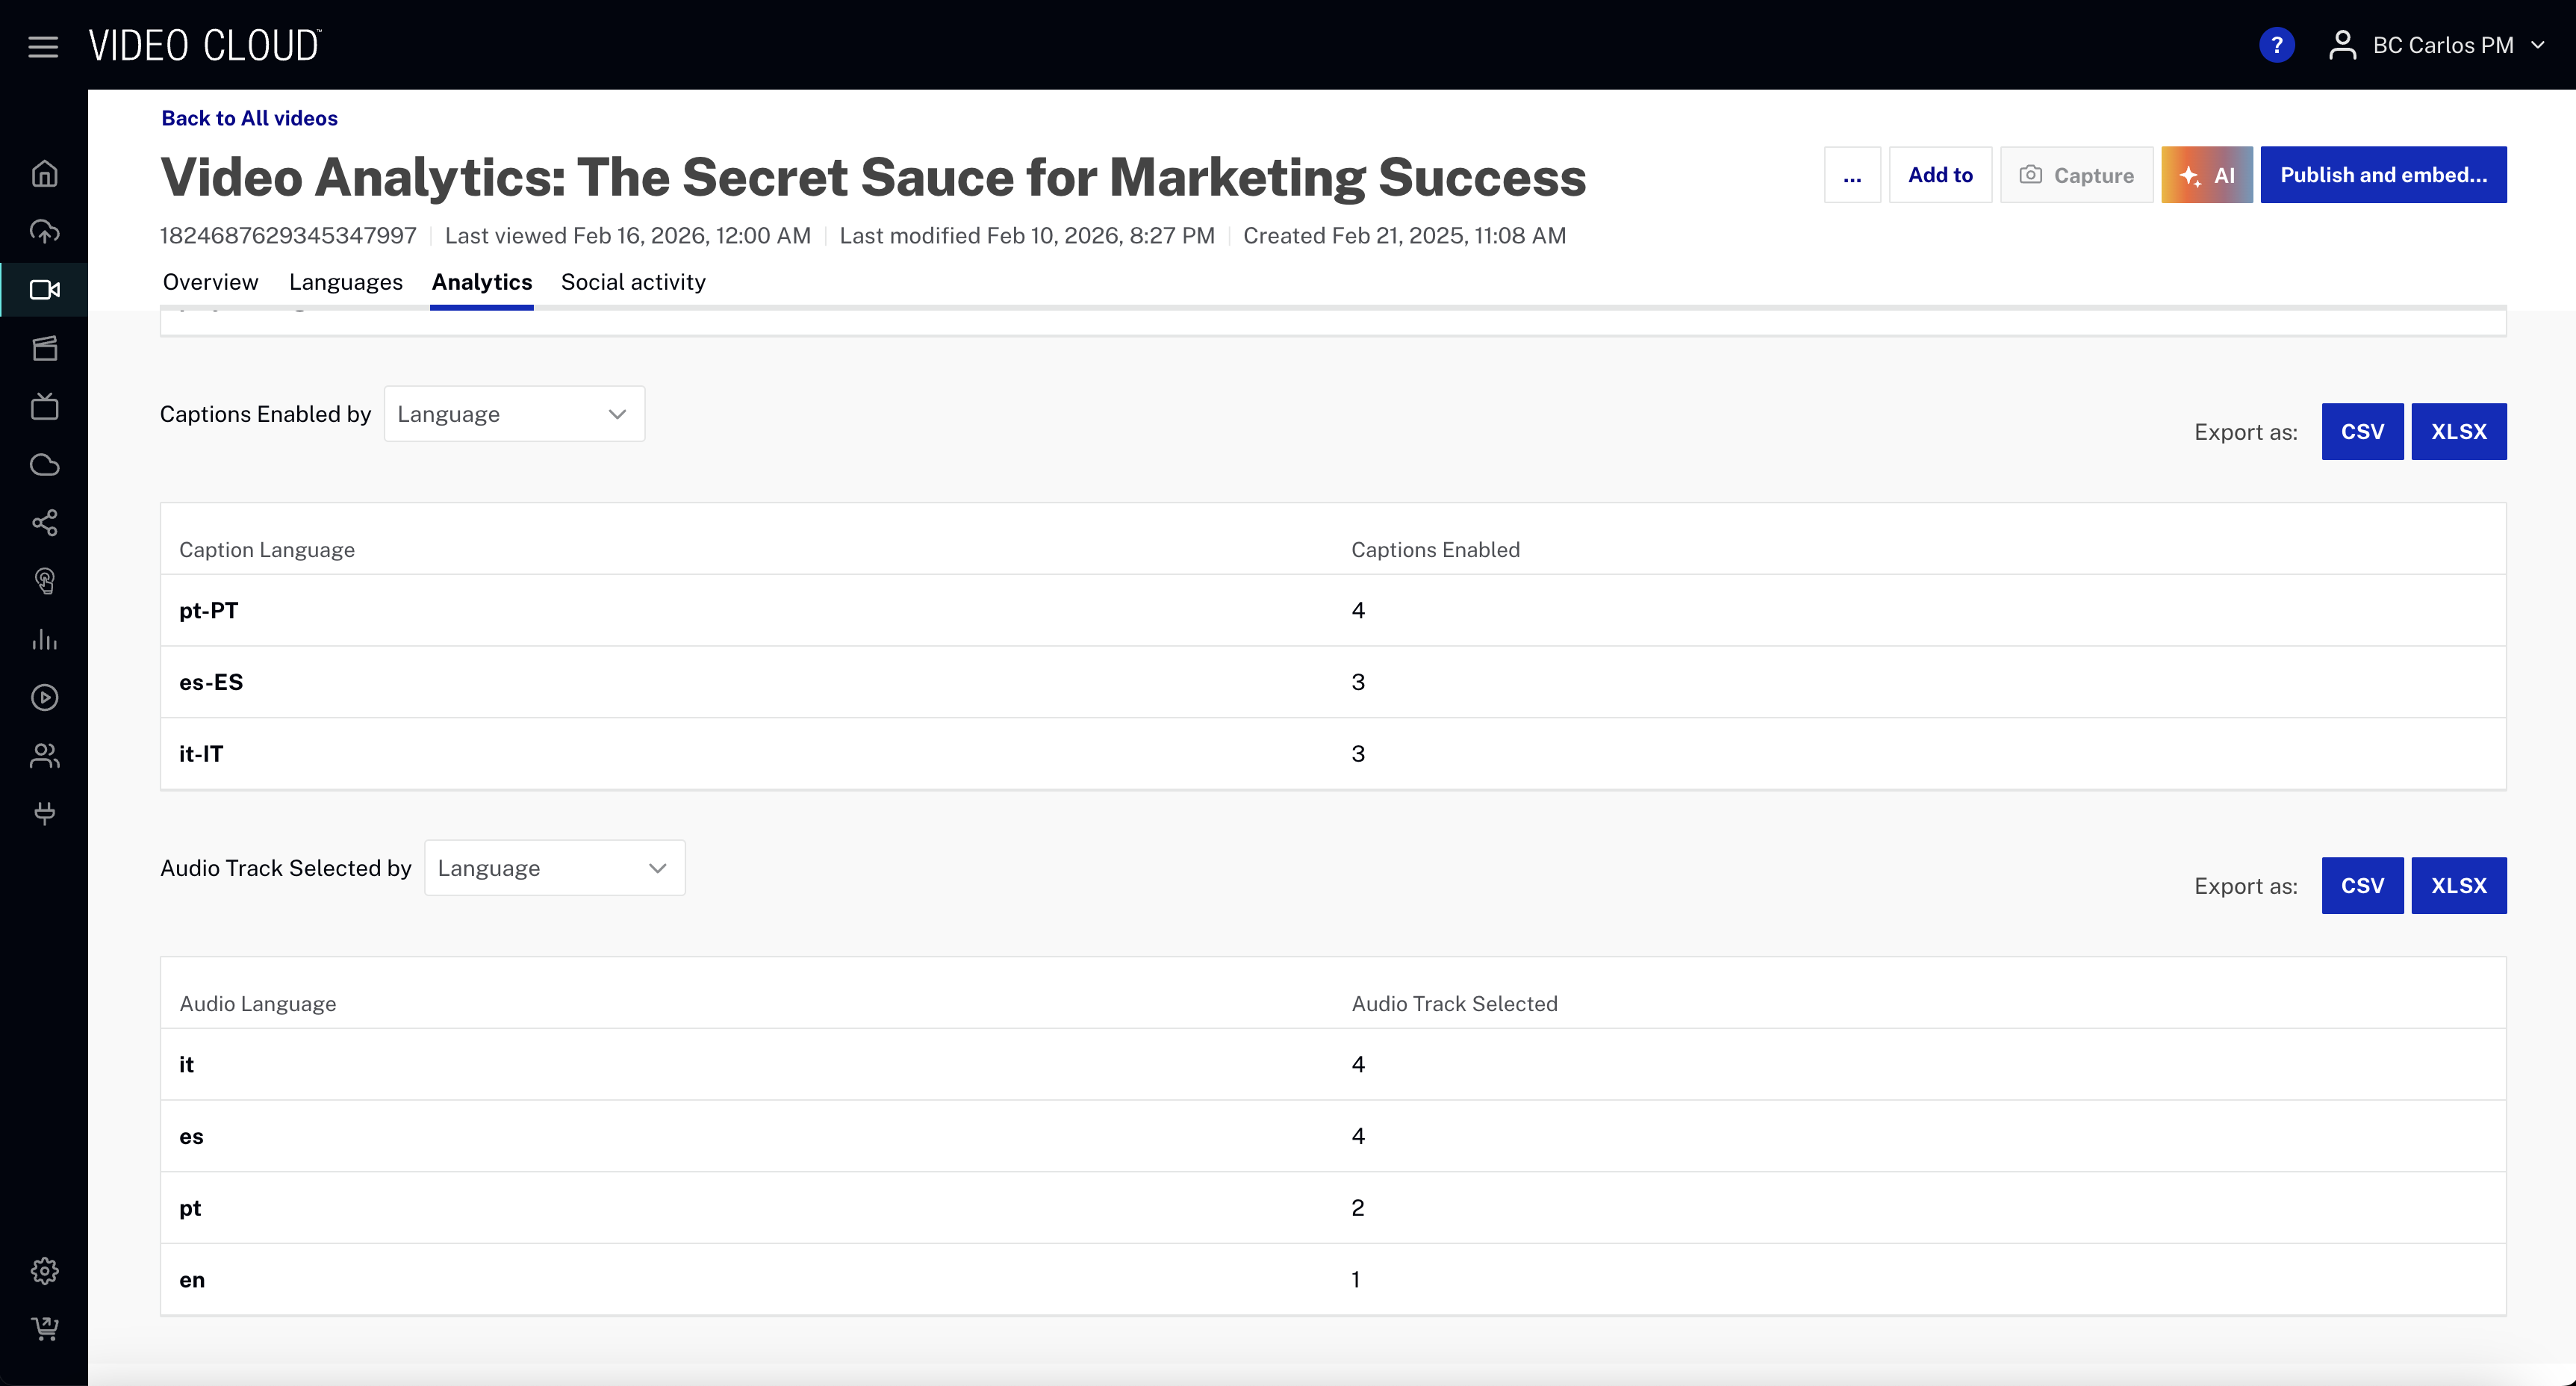
Captions Enabled by Language
This table shows which caption languages viewers have enabled and how many times captions were enabled for each language. Each row displays the caption language code and the Captions Enabled count.
Audio Track Selected by Language
This table shows which audio track languages viewers have selected and how many times each audio track was selected. Each row displays the audio track language code and the Audio Track Selected count.
Actions
- Use the Language grouping dropdown to view the data grouped by language.
- Click
 to export data as a CSV or XLSX file.
