Introduction
Ad insights help you understand the impact of your ad monetization on your audience's engagement.
Ad insights will show the relationships between ad frequency/intensity and session length/frequency to help customers understand the most effective ad loads.
Ad insights are integrated with video delivery, and analytics. These insights include:
-
Ad Tolerance:
Informs your ad strategy about factors that could reduce abandonment.
Setup
Ad insights are available to Media Video Cloud customers at no extra charge. Contact your Customer Success Manager to enable your account.
Navigation
Once your account is enabled for Ad Insights, you will find them in the Analytics module in Studio.
- Open Video Cloud Studio.
- In the left navigation, click the Analytics icon.
- In the Analytics left navigation, click Ad Insights.
Requirements
To be able to collect data from Ad Insights, you must:
- Have the basic ad configuration integrated with our Brightcove Player v6.x and above. For more information about the plugins and the setup for advertisement, see here.
- If a Non-BC player is being used, or the player used doesn't have the basic ad configuration, you need to instrument the player with the
ad_mode_beginandad_mode_endevents. For more information about these events see Data Collection API Reference. - Be a customer who purchased Ad Monetization or Media Studio Premium.
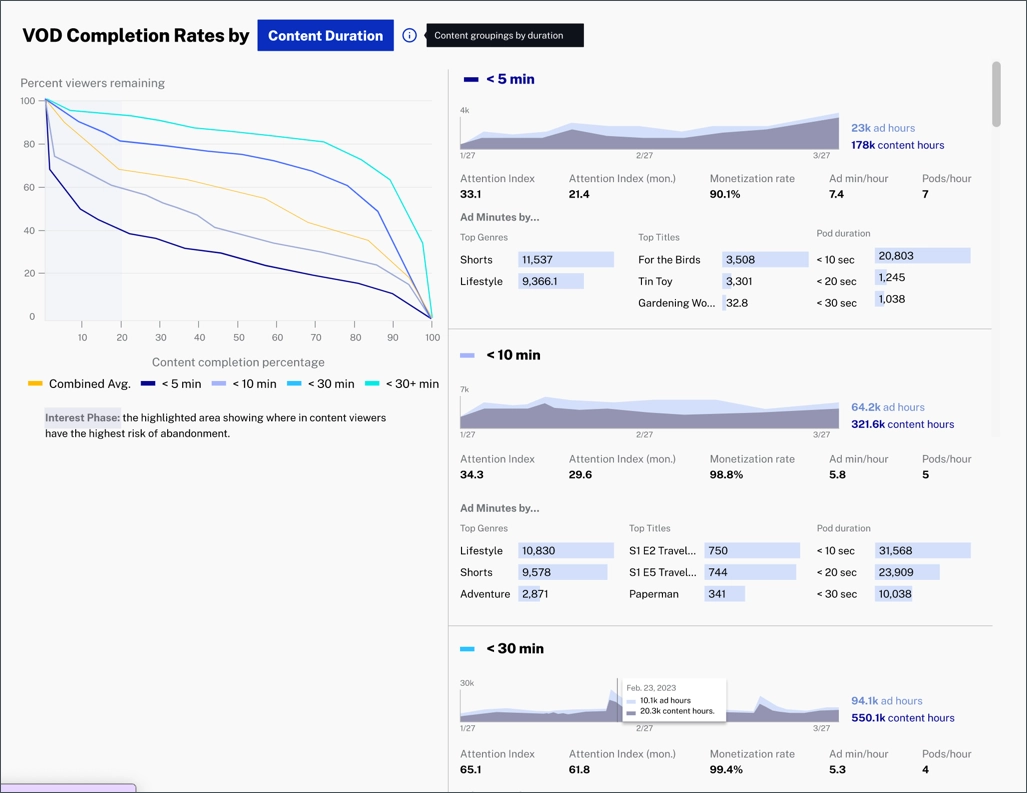
VOD Completion Rates
Track your content completion rates filtering by content duration.
Dimensions
VOD Completion rates by:
- Engaged Views
- Hours watched
- Audience size
- Pod duration
Data view
The y-axis of this chart shows the percentage of viewers that remained watching the content. This chart provides information on when the audience is dropping out and is normalized based on content duration.
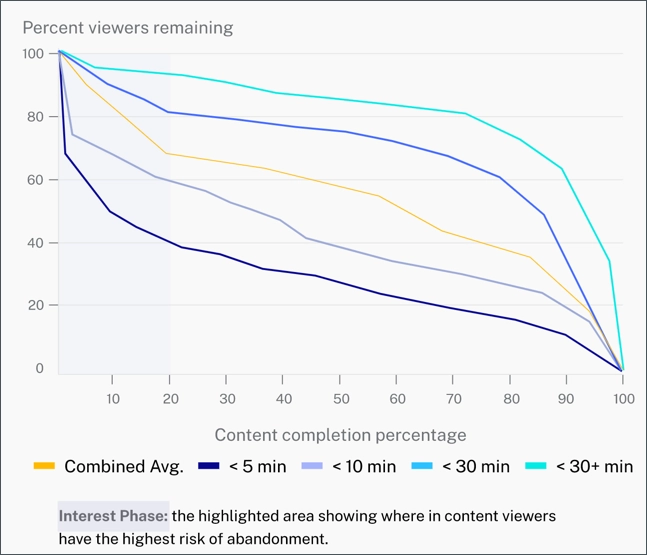
The following charts explain each one of the categories in detail:
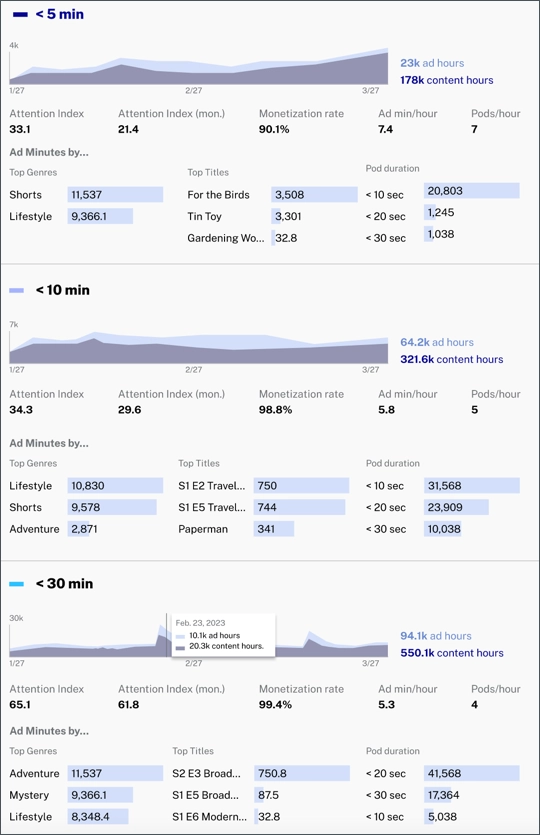
Values
- Attention index - Average how long the user remained
- Attention index (mon) - Attention index for monetized content
- Monetization rate - Number of views that have been successfully monetized for this category
- Ad minutes/hour - Ad minutes versus hours
- Pods/hours - Number of ad pods per hour