Reviewing Live Analytics
Overview
The Live module provides reports on live streaming event or channel performance. Information including real-time concurrent viewers and aggregated post-event data about the viewer's stream time, geography, and devices are available.
To view live analytics, follow these steps:
- Open the Live module.
- Click on an event name.
- Click Reporting in the left navigation.
The analytics dashboard is organized into the following sections:
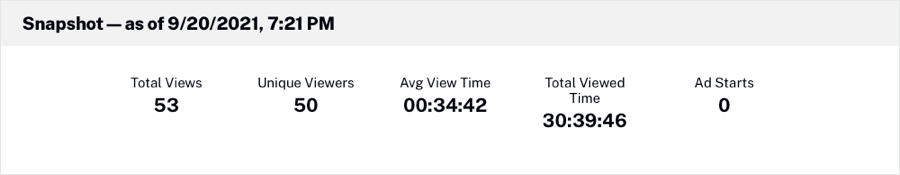
Snapshot
The Snapshot section will display
- Total Views - Total number of views over the duration of the live stream.
- Unique Viewers - Total number of unique viewers watching the stream. For example, if the same user connects to the live stream two separate times within an hour, they would count as 1 unique viewer.
- Avg View Time - Average time of consumption for any given session. For example, if User A watches one-minute of content and User B watches two minutes of content the Avg View Time is 1.5 minutes.
- Total Viewed Time - The total amount of time consumed over the duration of the stream displayed in hours:minutes:seconds.
- Ad Starts - Number of ad starts
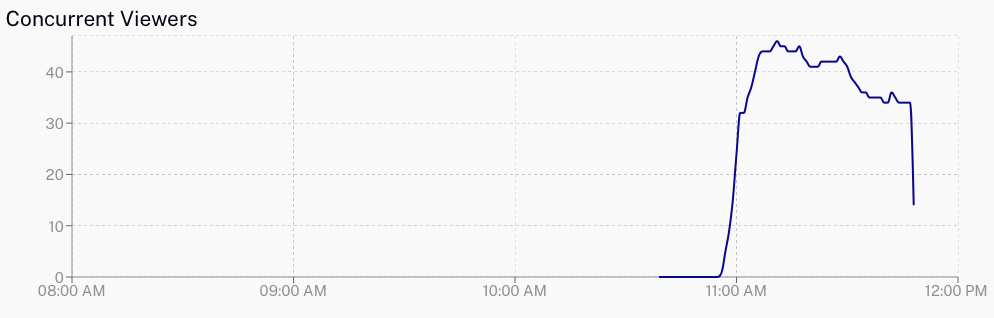
A graph displaying Concurrent Viewers will be displayed below the Snapshot. Concurrent viewers measures the number of sessions connected to the stream at any given time regardless of position. For example, if 10 users are watching the live stream at the live edge and 5 users are watching in the DVR window (10 minutes behind live) the concurrent viewers for the minute will be 15 users.
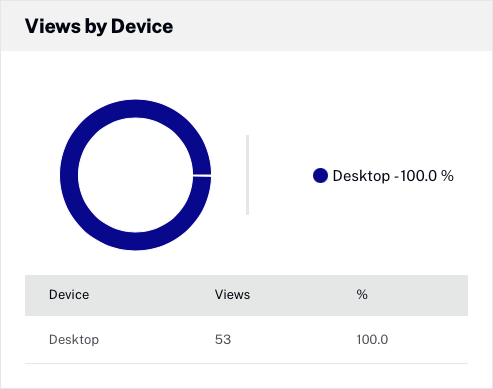
Views by Device
The Views by Device section will display a graph with the number of views by device. Possible device types are:
- Desktop - Includes desktop and laptop computers
- Tablet - Includes iPads, Android tablets, etc.
- Mobile - Mobile phones
- Connected TV/Game Console/Companion Device - Includes Smart TVs, set-top boxes and game consoles
- Other - For user-agents which are not mapped to any of the above
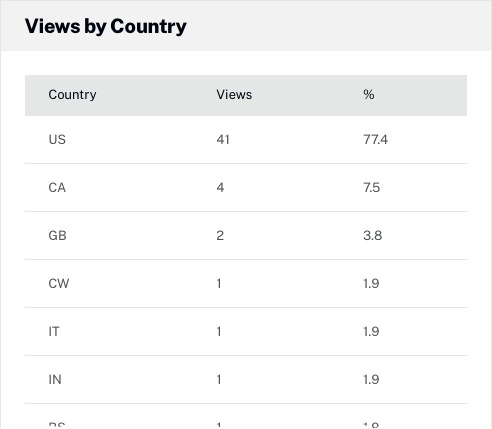
Views by Country
The Views by Country section will display a graph with the number of views by country.
Exporting report data
The live event report data can be exported to a Microsoft Excel file by clicking on the XLSX button.
Notes
General notes related to live analytics:
- Analytics are recorded for the default live video ID generated with a Live event. If a customer takes the m3u8 playlist for playback, or creates a remote asset with it (a new video ID), the analytics won't be collected for the new asset.
- Only Concurrent Viewers will be presented in real-time; other metrics will be collected and aggregated with a delay similar to standard analytics
- Concurrent Viewers is only accurate for streams that are delivered with the Brightcove Player and SDKs (or non-Brightcove Players using the Brightcove Data Collection API)
- Data will be available for up to 32 days after the event
- Real-time is defined by the aggregated sessions over a one-minute interval
- With recurring events (static entry points), analytics will be provided from the start of the most recent activation
- At the moment, the analytics module cannot fetch the precise "unique viewer" data and has a discrepancy between LIVE module analytics. Please use the LIVE Analytics UI to confirm the number of viewers.
- Certain ad blockers will prevent Live analytics data from loading properly, as shown below:
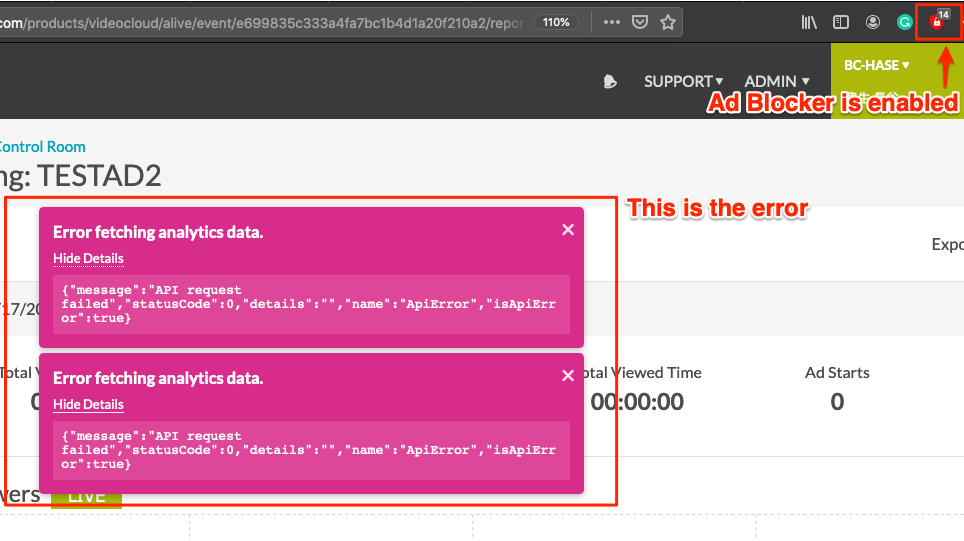
Ad Blocker Blocks Analytics Data Disabling the ad blocker should resolve the issue.