Introduction
This tab is designed to tailor your reporting data, understand audience engagement, and optimize content based on key metrics.
Content Period
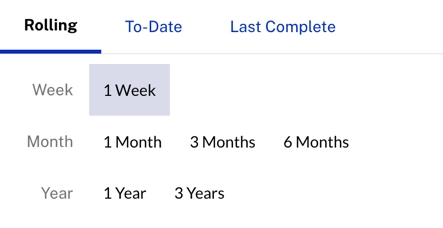
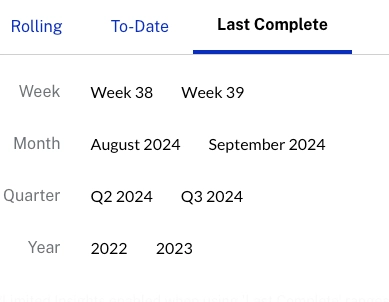
On the Insights section, click the week button to select the specific date for your reporting data.

By clicking the following tabs the different options to retrieve data will be displayed:
-
Rolling - Provides metrics for the most recent week, month, or year.
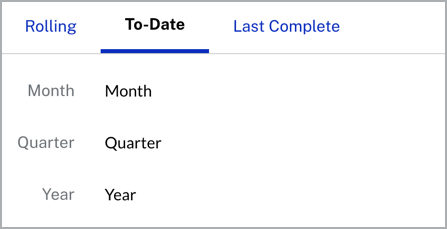
-
To-Date - Tracks progress from the beginning of the selected time frame to now.
-
Last Complete - Provides finalized metrics for the last full time period.
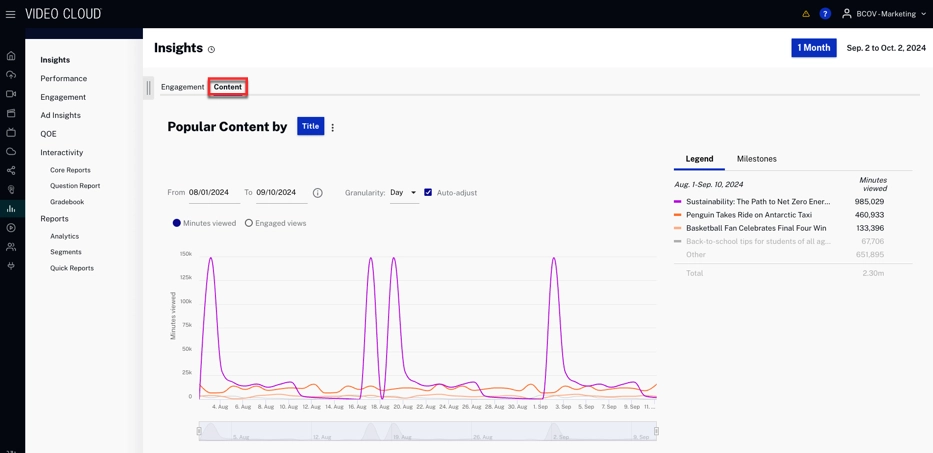
Popular Content by
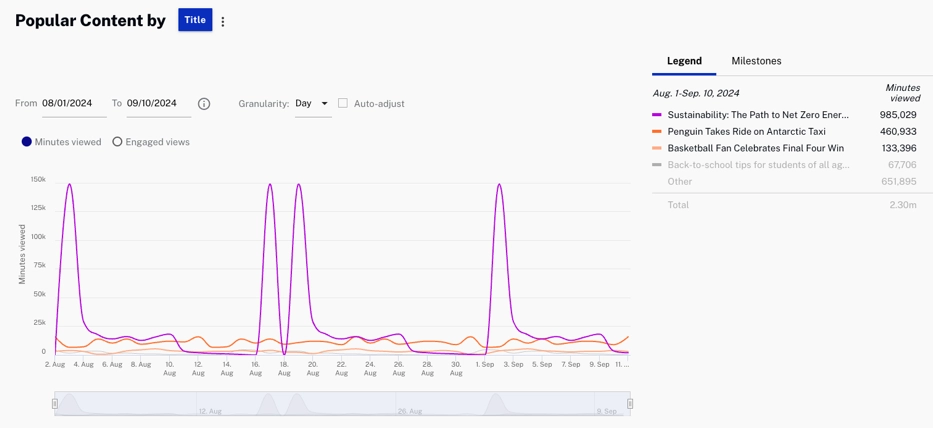
Popular content by metrics allow you to quickly determine how engaged your audience is with your content. With this information, it is possible to visualize all the content attracting the viewers' attention, making it possible to collect the hours viewed and the views of the videos.
Viewing options
The following are the viewing options you can use:
: See the performance of individual content titles based on minutes viewed or engaged views.
: Track how different marketing sources impact content engagement.
: Understand which marketing channels are driving the most engagement for your content.
Actions
Here are the actions that are available for this graph.
-
Click
 to download data as a CSV
file or a PNG image.
to download data as a CSV
file or a PNG image.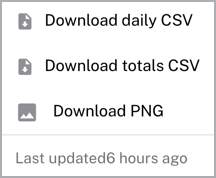
Select a date range for your data.
Select the x-axis granularity to be Day, Week or Month.
- Check
 to automatically change the x-axis dimension
to day.
to automatically change the x-axis dimension
to day.
- Select
 to automatically change the data by minutes viewed or Engaged views.
- Hover over the legend section to see the specific data for each content listed.
Milestones
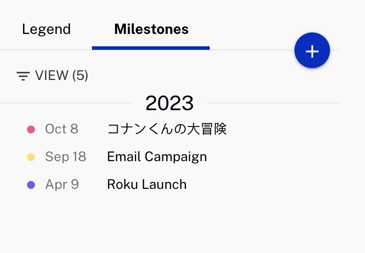
Milestones track progress against your decisions and are persistent throughout each tab of the Scorecard.
Actions
Here are the actions that are available for the milestones section.
-
Click
 to add a new
milestone.
to add a new
milestone.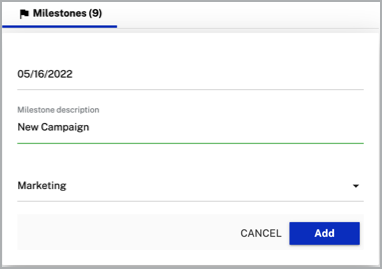
- Specify the date that corresponds to this milestone.
- Provide a brief description or title.
- Select the appropriate category that best describes the type of milestone.
-
Click
 to delete or edit a
milestone.
to delete or edit a
milestone.
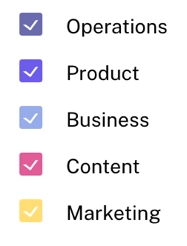
-
Click
 to filter the different view categories.
Key metrics
This section provides key metrics related to viewer interaction with your content. Each metric offers insights into specific aspects of content performance and viewer behavior over a 30-day period, along with Year-over-Year (YOY) comparisons to help assess long-term trends in engagement.
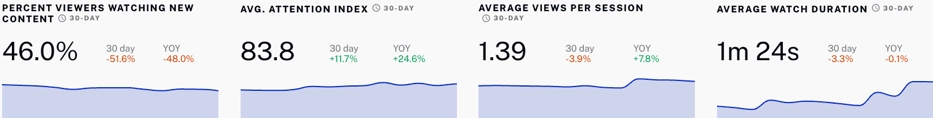
Percent Viewers Watching New Content: This metric shows the percentage of viewers who engaged with newly released content, helping you assess how well new material is performing compared to older content.
Average Attention Index: A measure of how attentive viewers are to your content, calculated based on interaction and time spent, which helps evaluate the quality of engagement.
Average Views per Session: This indicates how many videos are being watched by viewers during each session, showing how deeply viewers engage in a single visit.
Average Watch Duration: This metric tracks the average time spent watching each video, providing insights into how long viewers stay engaged with your content.
Actions
- Click to download data as a CSV
file.
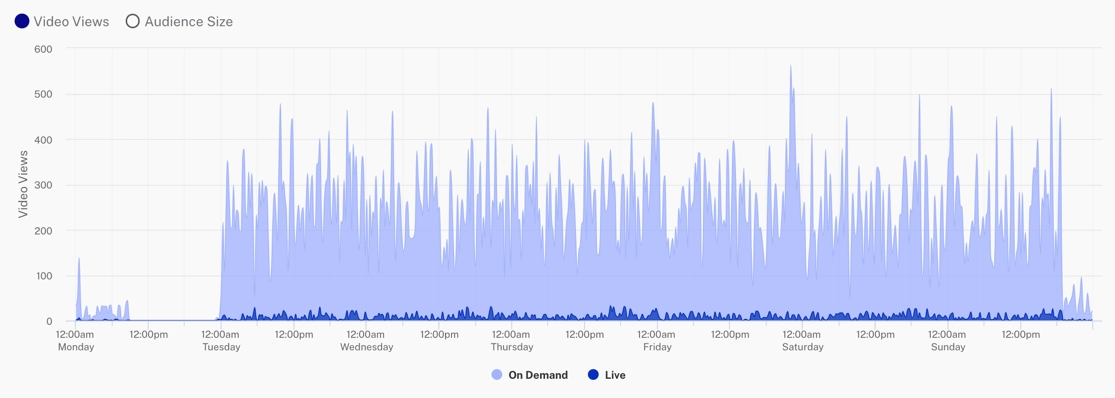
Viewing by Day Part
The Viewing by Day Part provides insights into the time of day when viewers consume content. This section helps identify peak viewing times, aiding in content scheduling and optimization.
Viewing by Day Part reflects the local time that a viewer consumed content, grouped by the time of day when the view occurred. If a view stretches across multiple day parts, that view will be counted in each of the day parts it spans.
Actions
Switch between Video Views and Audience Size to visualize the total number of views your content received or the size of the audience engaging with that content.
- Click
 to download data as a PNG image or a PDF document.
file.
to download data as a PNG image or a PDF document.
file.
- Click or Hover over
 to automatically show a specific
graphic for On Demand or Live content.
to automatically show a specific
graphic for On Demand or Live content.
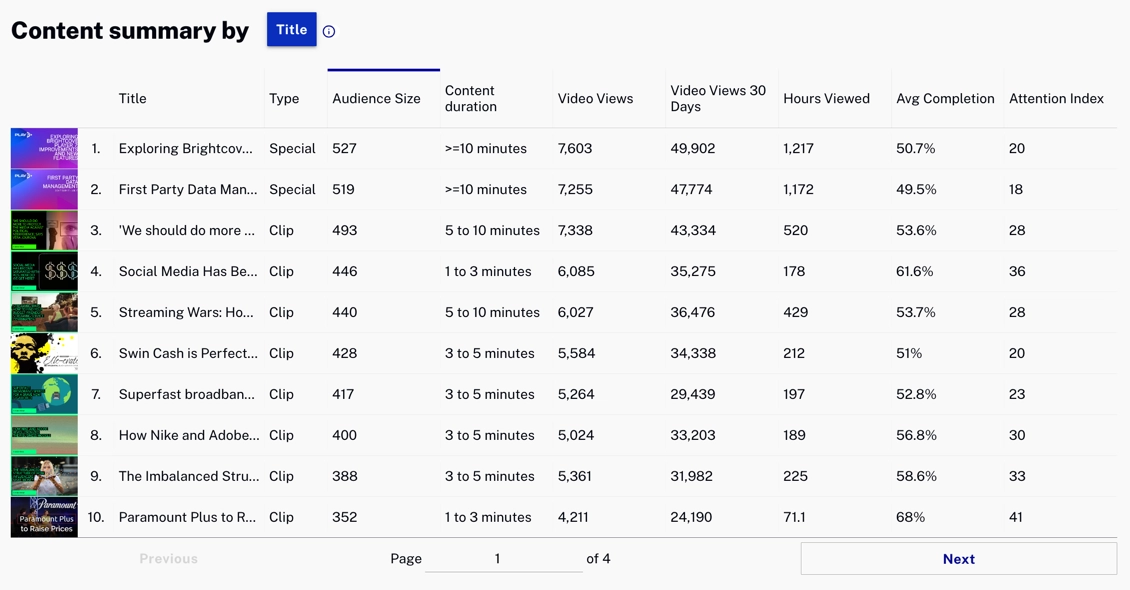
Content Summary By
This chart allows you to track your top 100 most popular titles, categories, and content duration. It provides a detailed summary of your content's performance sorted by attributes, helping you identify top-performing content. This enables you to assess engagement trends and make data-driven decisions to optimize content strategy.
VOD Completion Rates by
The VOD Completion Rates section provides insights into how viewers complete video-on-demand (VOD) content. The right-hand chart tracks the percentage of viewers who remain engaged throughout the content, helping you identify where abandonment happens, especially during the highlighted "Interest Phase," where viewer dropout is most likely. This data helps optimize content and improve retention.
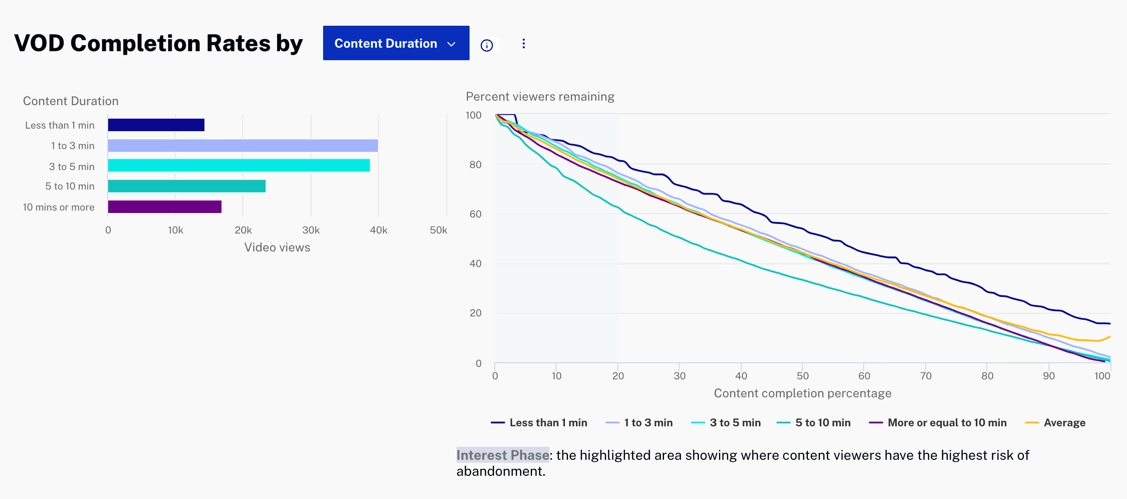
The y-axis of this chart shows the percentage of viewers that remained watching the content.
Viewing options
The following are the viewing options you can use:
: Analyzes completion rates based on the length of the content, helping you understand how duration affects viewer retention.
: Tracks how viewers engage and complete content based on specific content categories like sports, tech, or entertainment.
: Compares completion rates across different video players to identify performance variations between player setups.
: Shows completion rates among your most popular videos.
: Evaluates completion rates based on where the viewers came from, such as homepage, Facebook, or affiliate links.
: Analyzes completion rates based on how viewers found your content, such as email, CPC, tweets, or other marketing mediums.
Actions
- Click to download data as a CSV
file.