Introduction
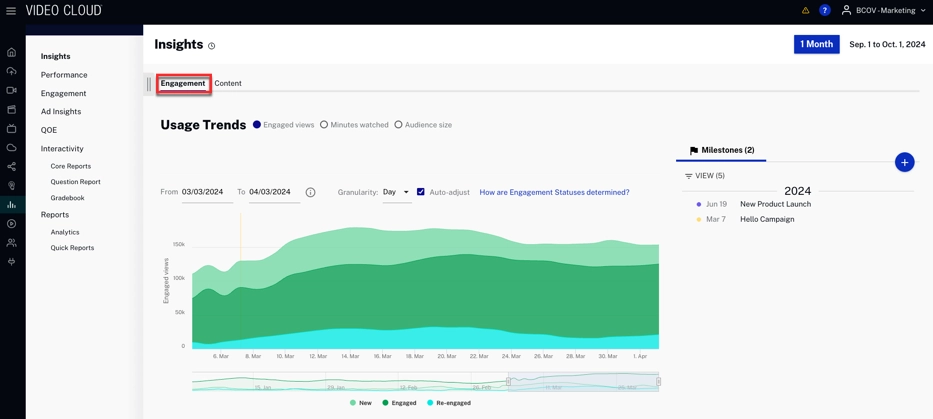
The Engagement dashboard for Marketing Insights delivers essential metrics that offer a clear view of how viewers interact with video content over time. By visualizing data trends, marketing and content teams can detect patterns, assess campaign performance, and refine strategies to boost engagement and viewer retention.
Date range
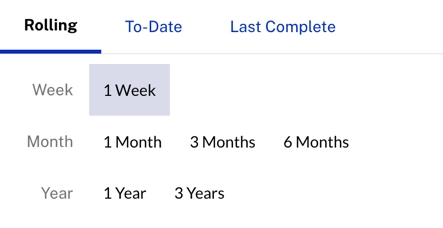
Click at the top-right to select the specific date range for your reporting data.

By clicking, the following, the different options to retrieve data will be displayed:
-
Rolling - Provides metrics for the most recent week, month, or year.
-
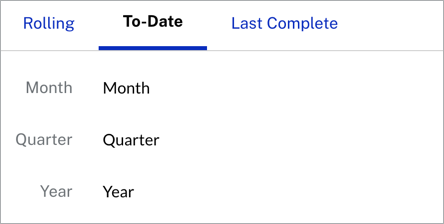
To-Date - Tracks progress from the beginning of the selected time frame to now.
-
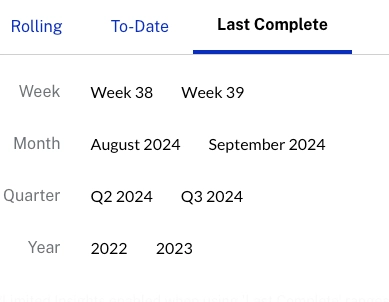
Last Complete - Provides finalized metrics for the last full time period.
Usage trends
Usage Trends shows Engaged views, minutes watched, and audience size grouped by trialists & subscribers.
Overview
Quickly view a summary of usage trends data per day.
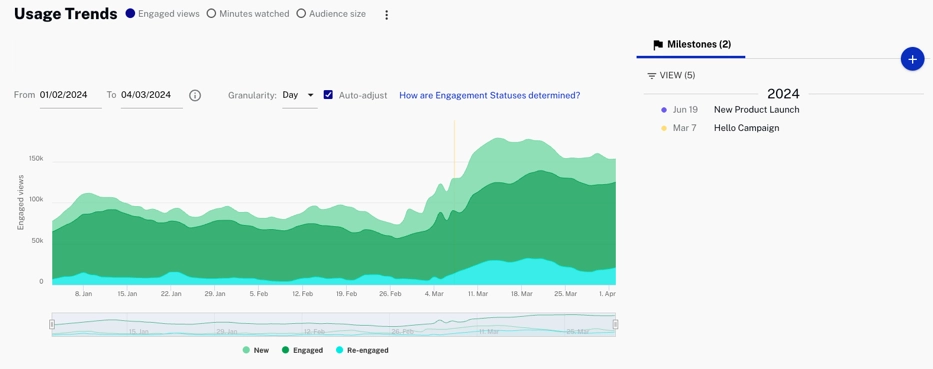
Review usage trends data:
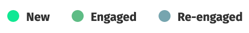
- New - Users with a view in the last week but none in the last year
- Engaged - Users with multiple views in the last month; views may not have gaps longer than 28 days from previous views
- Re-engaged - Users with a view in the last week but no views in the prior four weeks
Actions
Select between Engaged views, minutes watched or audience size.

- Click
 to download data as a CSV
file or a PNG image.
to download data as a CSV
file or a PNG image.
- Select a date range for your data.
- Select the x-axis granularity to be Day, Week or
Month.
- Check
 to automatically change the x-axis dimension
to day.
to automatically change the x-axis dimension
to day.
- Click or Hover over
 to automatically show a specific
graphic for New, Engaged and Re-engaged.
to automatically show a specific
graphic for New, Engaged and Re-engaged.
Engagement Statuses
-
Disinterested user
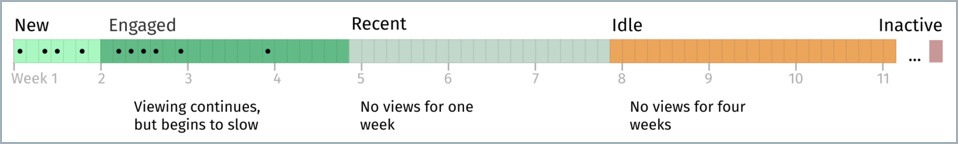
Disinterested User -
Spotty viewing
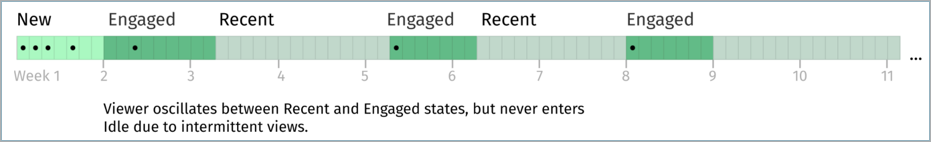
Spotty viewing -
Seasonal viewing
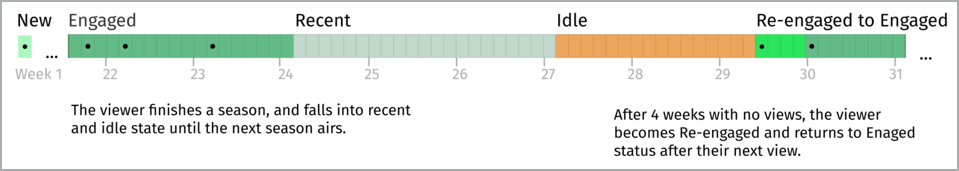
Seasonal Viewing
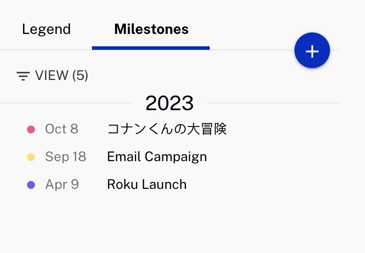
Milestones
Milestones track progress against your decisions and are persistent throughout each tab of the Scorecard.
Actions
Here are the actions that are available for the milestones section.
-
Click
 to add a new
milestone.
to add a new
milestone.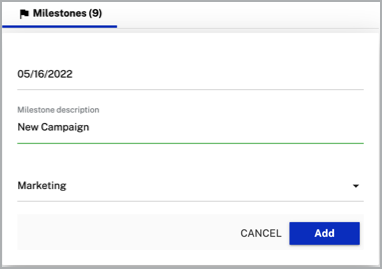
- Specify the date that corresponds to this milestone.
- Provide a brief description or title.
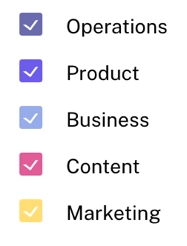
- Select the appropriate category that best describes the type of milestone.
-
Click
 to delete or edit a
milestone.
to delete or edit a
milestone.
-
Click
 to filter the different view categories.
Key metrics
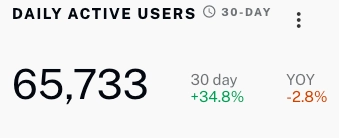
This section displays key engagement metrics over a specific time period with a comparison to the previous 30 days and year-over-year (YOY) performance, providing insights into viewer behavior.
Daily Active Users: The total number of unique users who engaged with video content within the past 30 days.
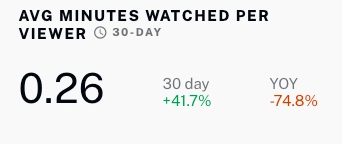
Average Minutes Watched Per Viewer: The average amount of time each viewer spent watching content over the last 30 days.
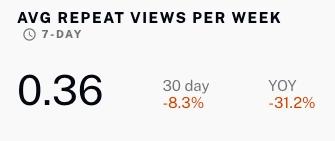
Average Repeat Views Per Week: Shows how many times viewers watched content on average per week, offering insights into viewer retention.
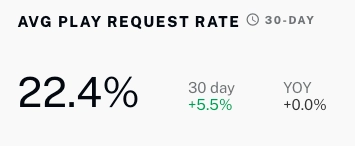
Average Play Request Rate: The percentage of video play requests relative to impressions, indicating how often viewers initiate content play
Engaged Views By
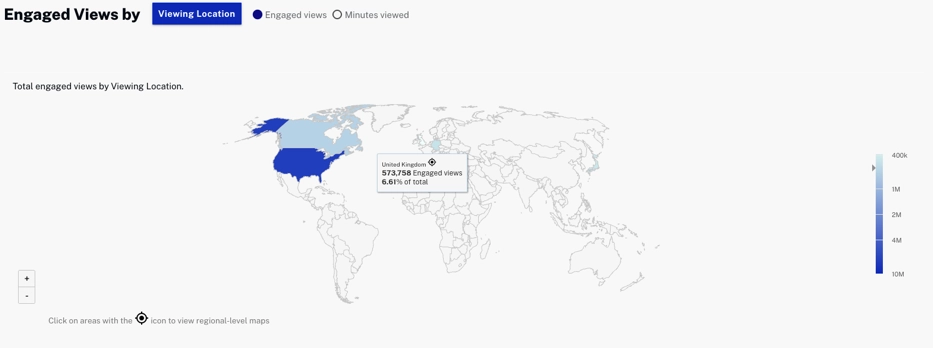
The Engaged Views by section shows total engaged views across different filters like Marketing Source, Device, or Marketing Campaign. By switching between filters, you can quickly see which sources or campaigns generate the most engagement, helping you focus your marketing strategies more effectively.
Viewing options
The following are the viewing options you can use:
: Analyze viewer engagement based on the devices used to access content, such as mobile, desktop, or tablet.
: Examine how viewer location affects engagement, providing insights into geographic performance.
- Hover Over Regions: By hovering over specific countries or regions on the map, you can view detailed engagement metrics such as the number of engaged views and the percentage of total views from that location.
- Zoom In/Out: Use the zoom feature to focus on specific areas of the map.
- Region Click: Clicking on a country or region will allow you to dive deeper into sub-regions, helping to understand engagement at a more granular level.
: Measure engagement across different players, offering insights into player performance and viewer preferences.
: Track engagement by marketing channels like YouTube, Facebook, and Google to see which platforms drive the most views.
: Assess how different marketing mediums, such as email, CPC, or social media, impact viewer engagement.
: Analyze engagement across different marketing campaigns to determine which ones are most effective.
: Break down viewer engagement by specific pieces of marketing content, helping identify top-performing materials.
Actions
Switch between Engaged Views and Minutes Viewed to analyze either the total number of views or the time spent watching content.
- Click
 to download data as a PNG image or a PDF document.
file.
to download data as a PNG image or a PDF document.
file.
Engagement Funnel by
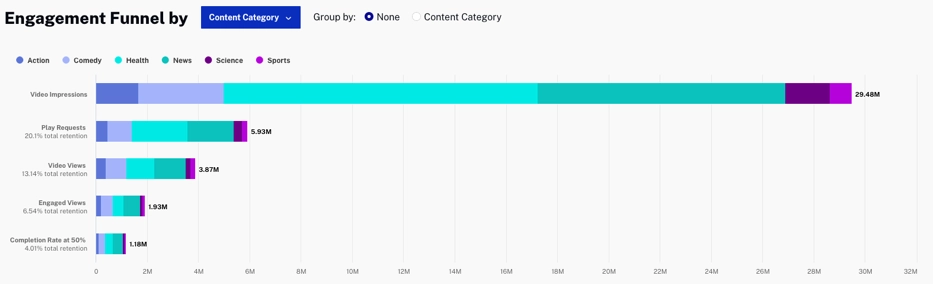
The Engagement Funnel by section shows how viewers interact with your content at each stage. It allows you to compare the performance of different content types and campaigns, helping you identify areas for improvement.
Engagement funnel categories
Video Impressions: The number of times the video player has been loaded on a webpage or app.
Play Requests: The number of times viewers clicked to start video playback.
Video Views: The number of times the video has started playing (first frame viewed).
Engaged Views: The number of viewers who watched at least 10% of the content.
Completion Rate at 50%: The number of viewers who watched at least 50% of the content.
The percentage shown under each category of the engagement funnel represents the proportion of viewers who progressed through each stage, starting from 100% of video impressions.
Viewing options
The following are the viewing options you can use:
: Analyze viewer engagement based on different content types, such as news, comedy, or sports.
: View how engagement is influenced by different sources, like YouTube, Google, or Facebook.
: Track how specific marketing campaigns perform across each stage of viewer engagement.
: Gain insights into how each content asset contributes to overall engagement.
: Compare engagement across different marketing channels, such as email, paid social, or referral.
Actions
Switch between Grouped by None and Grouped by Selected Filter to focus on specific insights.
- Grouped by None:This view shows all metrics aggregated without any specific grouping, allowing you to see overall performance across the funnel stages.
- Grouped by Selected Filter: This option groups the data based on the selected filter, providing a clearer comparison of performance across different segments.
Sessions Over Time
The Sessions Over Time section provides a visual representation of how viewer sessions evolve over a selected time period. It tracks New, Engaged, and Re-engaged sessions, along with average session duration.
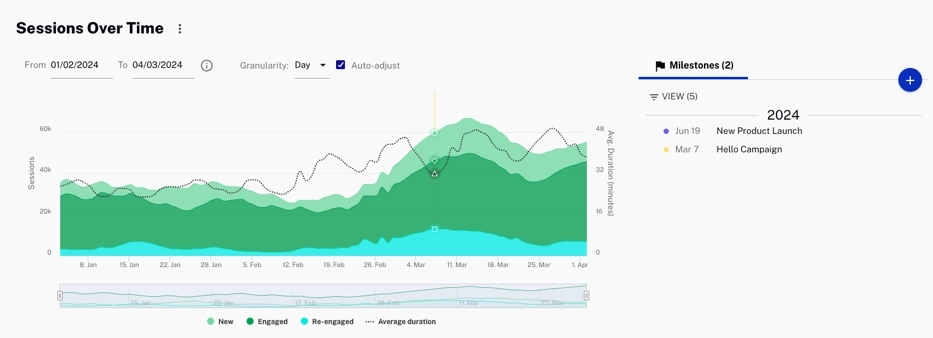
Actions
- Click to download data as a CSV
file.
- Select a date range for your data.
- Select the x-axis granularity to be Day, Week or
Month.
- Check to automatically change the x-axis dimension
to day.
- Click or Hover over
 to automatically show a specific
graphic for New, Engaged, Average duration and Re-engage.
to automatically show a specific
graphic for New, Engaged, Average duration and Re-engage.
- Specify the date that corresponds to this milestone.
- Provide a brief description or title.
- Select the appropriate category that best describes the type of milestone.
-
Click
to delete or edit a
milestone.
-
Click
to filter the different view categories.
Click to add a new
milestone.